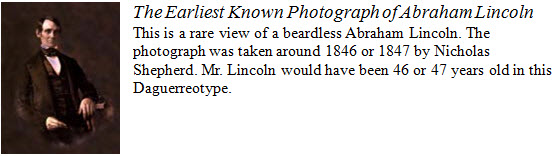
⠀⠀⠀⠀⠀,',photograph,' ..,! ,e>lie/ ,"kn
⠀⠀⠀⠀,photograph ( ,abraham .,l9coln ,?
⠀⠀⠀⠀is a r>e view (a be>d.s ,abraham
⠀⠀⠀⠀,l9coln4 '''
6.1 Fundamentals
6.2 Format
6.3 Descriptions
6.4 Omitted Illustrations
6.5 Concept Maps, Graphic Organizers, Idea Webs
6.6 Flowcharts
6.7 Forms
6.8 Genealogical Charts
6.9 Organizational Charts
6.10 Timelines
6.11 When a Tactile Graphic is Not Produced
6.12 Screenshots
6.13 Slide Presentations
6.14 Samples
6.1.1 For our purposes, illustrative material applies to photographs, maps, drawings, etc. Specialty types of graphic materials, e.g., graphic novels and cartoons are discussed in Section 14, Plays, Cartoons, and Graphic Novels.
6.1.2 Special Symbols and Transcriber's Notes
6.1.3 The preferred method for conveying information from illustrations, e.g., maps, Venn diagrams, bar charts, etc. is by the use of tactile materials. Guidelines and Standards for Tactile Graphics, 2010 should be followed when producing graphics.
6.1.4 A Braille Reader's Perspective
Graphics should be reproduced when possible, or if the student needs to understand the conventions used in the illustration as part of professional training.
One way of testing a picture description is to see if someone unfamiliar with the book can answer the question, perform the task described, or get the joke without having seen the print book. If a sighted person cannot understand a tactile graphic in a subject with which he is familiar, a similarly knowledgeable braille reader will not understand it either.
6.2.1 The format for illustrations makes captions and descriptions standard and easy to locate.
a. All print captions accompanying images are included. Any associated copyright information, which may appear alongside the image, is included in a new paragraph after the completion of the caption. Follow print for wording and sequence of information.
b. Some illustrative materials may require a transcriber-generated description.
6.2.2 Print captions and transcriber-generated descriptions are in 7-5.
a. Do not insert blank lines before or after captions or descriptions unless required by other formats (e.g., headings, lists, etc.).
b. Each illustration is identified first, e.g., Photograph, Caption, Figure, with the identifier enclosed in Transcriber's Note symbols. Word content, either a print caption or a transcriber-generated description, follows on the same line after the identifier. No punctuation is needed between the two segments as the Transcriber's Note symbol is sufficient separation.
|
⠀⠀⠀⠀⠀,',photograph,' ..,! ,e>lie/ ,"kn |
c. Source citations for an illustration are shown immediately following the caption in 7-5.
d. Follow print for numbering style used for illustrations, e.g., hyphens, decimals, etc. Use the decimal point when a dot is part of a label number.
|
⠀⠀⠀⠀⠀⠀,,figure #bj.a ,! balloon & |
e. When both a print caption and a transcriber-generated description are needed, do not insert a blank line between them.
See Sample 6-1: Figure with Source Information on page 6-14.
6.2.3 Usually an illustration is inserted as close as possible to corresponding discussion in the text. If an appropriate location is not apparent, place it after the last full paragraph on the page on which it appears. Do not interrupt a sentence for the illustration.
6.2.4 When an illustration is on a page other than where it is discussed, it may be necessary to move it from the original location so that it will appear near the pertinent text. Moving content to another page should be done only after careful consideration, as typically it is best to follow print. When an illustration is moved to a different print page, insert a transcriber's note at the original location giving the print page number, including the continuation letter, of the new location. A second transcriber's note is inserted before the illustration at its new location, stating the page number of its original position in print.
6.3.1 Some images may require a description, which is enclosed in a transcriber's note following the caption. Use appropriate vocabulary for the grade level and subject matter.
|
⠀⠀⠀⠀⠀⠀,',picture,' _.,views _.( _.ang] |
6.3.2 The National Center for Accessible Media (NCAM) conducted research and posted information for writing descriptions for STEM (Science, Technology, Engineering, and Math) images. Effective Practices for Description of Science Content within Digital Talking Books is geared towards digital talking books, however there are many applicable points for writing descriptions in transcriber's notes.
The key points pertaining to braille production in the STEM Description Guidelines are:
Brevity: Use as few words as possible.
Data: Focus on the data and not on extraneous visual elements.
Clarity: The reader should be able to understand the description in one reading.
Drill-Down Organization: Start with a brief description, followed by more specific information. This allows the reader to get the initial concept and read further if desired.
Tables: Some content is better converted to tables than being provided in a narrative description.
Processes: Some processes presented visually can be converted to nested lists.
Narrative Description: Many illustrations are best described in a linear, narrative format. When writing narrative descriptions, follow the first four guidelines: brevity, data, clarity and drill-down organization.
The following website provides more detail about each of these points.
http://ncam.wgbh.org/experience_learn/educational_media/stemdx/guidelines
6.4.1 Some illustrations, such as ones inserted in print for visual appeal, may be omitted. The relationship of the illustration to the text is what is important. Consult the requesting agency. Include a statement on the Transcriber's Notes page when all illustrations of a particular type, e.g., photographs without captions, are omitted.
6.4.2 Insert a transcriber's note at each point of omission when only some of the images are not included. This is especially important when some numbered illustrations are not included. Sample:
Photograph is omitted.
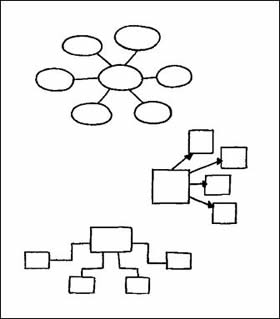
6.5.1 Concept maps have a central idea with rays branching out to subordinate ideas. These concept maps are done as a tactile graphic whenever possible. When a request is made for a text-based format, use a nested list (1-5, 3-5; 1-7, 3-7,
5-7; etc.) to indicate the individual elements of the web. The central idea of the concept map is the first level in the nested list. Other elements are listed in the appropriate level in a logical order, e.g., top to bottom; right to left, etc. A careful reading of the concept map may dictate another placement order. Use a double dash to indicate blank elements.
|
See Sample 6-2: Concept Map on page 6-15.
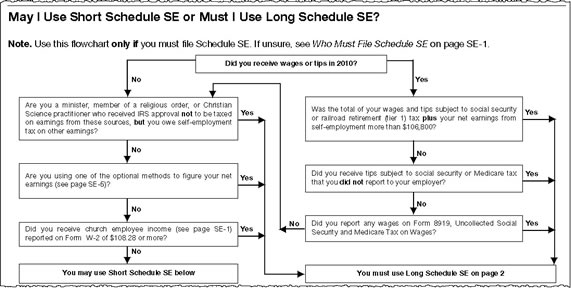
6.6.1 A flowchart is a diagram showing the step-by-step progression through a procedure or system, using connecting lines and symbols. Flowcharts frequently have Yes or No paths to follow. Use the Computer Braille Code Supplement, Flowchart Design for Applicable Braille Codes for these situations.
|
6.7.1 Print forms are illustrations of pre-printed documents. Some are informative, others have blanks to be filled in or choices to be made.
6.7.2 When a form is omitted:
a. Omit forms included only for visual interest, that aren't necessary for understanding content.
b. A transcriber's note is used to identify the form and briefly describe it.
6.7.3 When a form is produced:
a. Give a brief description of the form first.
b. Do not reproduce print forms spatially.
c. Enclose the form in boxing lines if appropriate. Avoid boxes within boxes unless it's essential for understanding the layout of the form.
d. Use a 1-3 list or 1-5, 3-5 nested list to present the items in the form.
e. Use a double dash to represent blanks to be filled in.
See Sample 6-3: Print Form starting on page 6-16.
f. An embedded transcriber's note is used to let the reader know how many write-on-lines appear in print when the lines imply the length of an answer.
g. Add emphasis to "written" responses to indicate sample replies. Include a transcriber's note about the added emphasis. Sample:
Sample written responses are italicized.
See Sample 6-4: Print Form with Sample Responses starting on page 6-18.
6.8.1 Descendant Charts
a. Descendants' genealogical charts are transcribed using a nested list format (1-5, 3-5; 1-7, 3-7, 5-7; etc.).
b. Descendant charts begin with the ancestors and descend to the most current generation.
c. Symbols used for marriage or other types of relationships, e.g., twins, are included in a transcriber's note. Sample:
Parallel lines are represented by the letter m.
See Sample 6-5: Genealogical Chart on page 6-20.
6.8.2 Ascending Ancestral and Pedigree Charts
a. Ancestral and Pedigree charts begin with the most current item or person and move backward through the generations. List all entry names in the chart in 1-3 and assign a number to each, beginning with the most current person. Assign sequential numbers, moving back through each generation and in the same direction as the chart. Sequential numeric identification allows the ascending parentage to be followed without using a tactile graphic.
b. List the numbered individuals and any information specific to the individual, e.g., date of birth. This information is followed immediately by the two numbers from the list that represent the parent. The two numbers are separated by a comma. Use a dash to represent the missing connection if only one parent is listed.
c. Insert a transcriber's note about the parentage numbers. Sample:
Each individual in the list is given an identifying number. The numbers following an individual are the identifying numbers for the parents. A dash rather than a number is used for a missing parent.
See Sample 6-6: Ancestral Tree starting on page 6-22.
See Sample 6-7: Pedigree Chart starting on page 6-24.
6.9.1 For our purposes, an organizational chart is a diagram of the structure and/or personnel of an organization. The principal parts or functions are represented by blocks connected by lines to show hierarchical rank or interrelationships. Use a nested list (1-5, 3-5; 1-7, 3-7, 5-7; etc.).
See Sample 6-8: Organizational Chart on page 6-26.
6.10.1 Timelines have many visual layouts from very simple lists to more complex graphics. All timelines are treated as a list and are transcribed in chronological order regardless of the order found in print.
a. Use a 1-3 list for a simple timeline.
b. For a complex timeline use a nested list (1-5, 3-5; 1-7, 3-7, 5-7; etc.).
c. Include the first and last date shown, with or without an associated event.
d. Omit all other dates without associated events.
e. The date is followed by the event on the same line.
f. Captions to images associated with an event are inserted at appropriate locations.
6.10.2 Timeline with Bars. Insert the range of years when bars are used to indicate a span of time. Usually it is necessary to provide an estimate of the dates. Include a transcriber's note to let the reader know all dates are approximate. The note goes on the Transcriber's Notes page when these types of timelines are used throughout the book.
See Sample 6-9: Timeline with Bars on page 6-27.
6.10.3 Timelines with Multiple Events in the Same Year. Use a nested list format when a date has more than one event. The date is in cell 1, and each event is in 3-5.
See Sample 6-10: Timeline with Multiple Events on page 6-28.
6.10.4 Multipage Timelines. Insert the timeline at the most appropriate location on the first page it appears. Precede the timeline with a transcriber's note to indicate the range of pages. Sample:
Timeline is across the bottom of pages 44-47.
6.10.5 Simple Shared Date Timelines. Timelines with a shared date and individual events are listed in 1-3.
See Sample 6-11: Simple Shared Date Timeline on page 6-29.
6.10.6 Complex Shared Date Timelines. Use a nested list format (1-5, 3-5; 1-7, 3-7, 5-7; etc.) when print shows several major topics with the timeline. Another option in some situations may be to list the events after a cell-5 heading.
See Sample 6-12: Complex Shared Timeline starting on page 6-30.
6.11.1 Although a tactile graphic is preferred, the following guidelines may be used when requested by an agency, when the time frame of the needed material is too short, or when there are multiple samples of the same type of graphic and only one graphic is produced as a sample.
6.11.2 It is necessary to present information in an appropriate format when images are not produced as tactile graphics and the content of the diagram is not included in the surrounding text. These options include lists, tables, and descriptions. Refer to the STEM guidelines.
http://ncam.wgbh.org/experience_learn/educational_media/stemdx/guidelines
6.11.3 A transcriber's note provides information about how the information is presented.
See Sample 6-13: Bar Graph starting on page 6-32.
See Sample 6-14: Venn Diagram starting on page 6-34.
6.12.1 Screenshots of web pages are used often as a teaching tool in textbooks. The format used to transcribe screenshots depends on the focus of the illustration.
a. Enclose all screenshots in a box.
b. Use transcriber's notes to indicate location and color cues as necessary.
c. Do not use Computer Braille Code unless the characters on the screen require it, e.g., a typed command.
6.12.2 Informative Screenshots. Group content in sections when screenshots are informative, i.e., used to teach internet research skills.
a. Retain headings and separations.
b. Transcribe all information necessary for understanding in a logical order.
c. Ignore color.
6.12.3 Descriptive Screenshots. These screenshots are used to teach website design.
a. A tactile graphic is frequently the best option if the purpose of the screenshot is to show the page design.
b. A complete and detailed description of the screenshot is provided when a tactile graphic is not possible. Include the following:
(1) Divide the web page into sections, e.g., navigation panel on the left, the tool bar on the top, the content area, the footer, etc.
(2) Describe text placement as needed.
(3) Indicate hyperlinks, which are a word, phrase, or image that can be clicked on to jump to a different location.
See Sample 6-15: Screenshot starting on page 6-36.
6.13.1 Slide presentations created in Microsoft PowerPoint, Corel Presentations, Keynote, etc., are often requested in braille, especially in a school environment.
a. Each slide number is treated as the print page number.
b. As text on slides may be informally structured, it is necessary to determine a format for best readability. Most text is formatted using headings, indented/blocked paragraphs, and lists.
c. Slide descriptions, when needed, are enclosed in a transcriber's note.
d. Speaker's notes, if included, are in 7-5. Notes begin with the identifier Notes, enclosed in transcriber's notes symbols, with the notes continuing on the same line.
See Sample 6-16: Slide Presentation starting on page 6-38.
Sample 6-1: Figure with Source Information, page 6-14
Sample 6-2: Concept Map, page 6-15
Sample 6-3: Print Form, page 6-16
Sample 6-4: Print Form with Sample Responses, page 6-18
Sample 6-5: Genealogical Chart, page 6-20
Sample 6-6: Ancestral Tree, page 6-22
Sample 6-7: Pedigree Chart, page 6-24
Sample 6-8: Organizational Chart, page 6-26
Sample 6-9: Timeline with Bars, page 6-27
Sample 6-10: Timeline with Multiple Events, page 6-28
Sample 6-11: Simple Shared Date Timeline, page 6-29
Sample 6-12: Complex Shared Timeline, page 6-30
Sample 6-13: Bar Graph, page 6-32
Sample 6-14: Venn Diagram, page 6-34
Sample 6-15: Screenshot, page 6-36
Sample 6-16: Slide Presentation, page 6-38