Sample 6-13: Bar Graph
Option 1: List Format
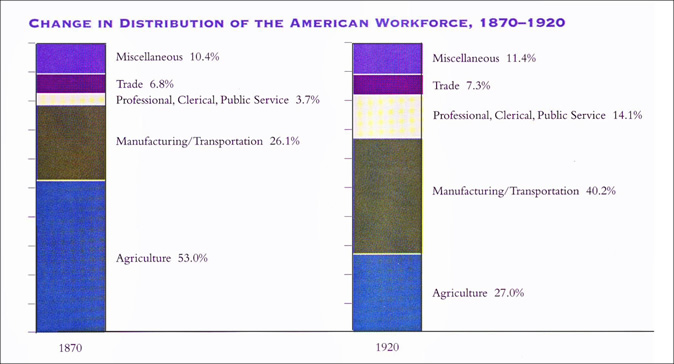
1 ⠀⠀⠀⠀⠀⠀⠀⠀⠀,*ange 9 ,4tribu;n (!
2 ⠀⠀⠀⠀⠀⠀,am]ican ,"w=ce1 #ahgj-aibj
3 ⠀⠀⠀⠀⠀⠀⠀⠀⠀⠀⠀⠀⠀⠀⠀⠀⠀⠀⠀⠀⠀⠀⠀⠀⠀⠀⠀⠀⠀⠀⠀⠀⠀⠀⠀⠀⠀⠀⠀⠀
4 ⠀⠀⠀⠀⠀⠀,',data f pr9t b> graphs is
5 ⠀⠀⠀⠀li/$4,'
6 ⠀⠀⠀⠀⠀⠀⠀⠀⠀⠀⠀⠀⠀⠀⠀⠀⠀⠀⠀⠀⠀⠀⠀⠀⠀⠀⠀⠀⠀⠀⠀⠀⠀⠀⠀⠀⠀⠀⠀⠀
7 ⠀⠀⠀⠀#ahgj
8 ,miscellane\s #aj.d@3p
9 ,trade #f.h@3p
10 '''
11 ⠀⠀⠀⠀⠀⠀⠀⠀⠀⠀⠀⠀⠀⠀⠀⠀⠀⠀⠀⠀⠀⠀⠀⠀⠀⠀⠀⠀⠀⠀⠀⠀⠀⠀⠀⠀⠀⠀⠀⠀
12 ⠀⠀⠀⠀#aibj
13 ,miscellane\s #aa.d@3p
14 ,trade #g.c@3p
15 '''
Option 2: Table Format
1 ⠀⠀⠀⠀⠀⠀⠀⠀⠀,*ange 9 ,4tribu;n (!
2 ⠀⠀⠀⠀⠀⠀,am]ican ,"w=ce1 #ahgj-aibj
3 ⠀⠀⠀⠀⠀⠀⠀⠀⠀⠀⠀⠀⠀⠀⠀⠀⠀⠀⠀⠀⠀⠀⠀⠀⠀⠀⠀⠀⠀⠀⠀⠀⠀⠀⠀⠀⠀⠀⠀⠀
4 ⠀⠀⠀⠀⠀⠀,',data f pr9t b> graphs is %[n 9
5 ⠀⠀⠀⠀a ta#4 ,numb]s 9 ! #ahgj & #aibj
6 ⠀⠀⠀⠀columns >e p]c5tages4,'
7 ⠀⠀⠀⠀⠀⠀⠀⠀⠀⠀⠀⠀⠀⠀⠀⠀⠀⠀⠀⠀⠀⠀⠀⠀⠀⠀⠀⠀⠀⠀⠀⠀⠀⠀⠀⠀⠀⠀⠀⠀
8 ⠀⠀⠀⠀⠀⠀⠀⠀⠀⠀⠀⠀⠀⠀⠀⠀⠀⠀⠀⠀⠀⠀⠀⠀⠀⠀⠀⠀#ahgj #aibj
9 ⠀⠀⠀⠀⠀⠀⠀⠀⠀⠀⠀⠀⠀⠀⠀⠀⠀⠀⠀⠀⠀⠀⠀⠀⠀⠀⠀⠀"3333 "3333
10 ,miscellane\s """""""""""" #aj.d #aa.d
11 ,trade """"""""""""""""""" #f.h #g.c
12 ,profes.nal1 ,cl]ical1
13 ⠀⠀,public ,s]vice """""""" #c.g #ad.a
14 ,manufactur+_/,transport,n #bf.a #dj.b
15 ,agriculture """"""""""""" #ec.j #bg.j